
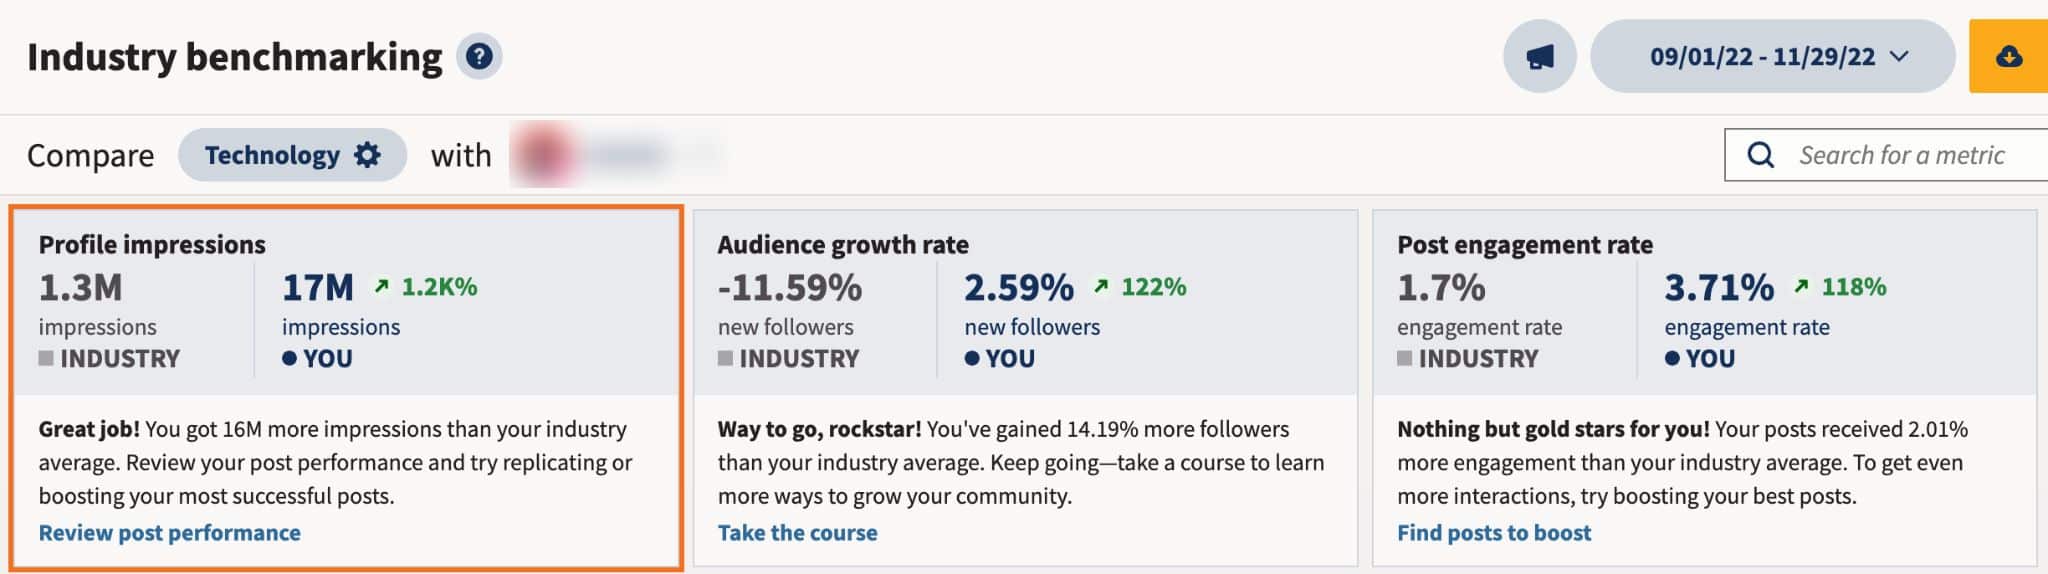
Compare your results to average engagement rates in your industry to get a better understanding of your performance — and brag about your wins with confidence.
So you’ve planned and launched a social media campaign, and waited patiently for the likes, comments, and conversions to roll in. Now you’re looking at your performance report, wondering what the numbers actually mean. Is a 2% engagement rate high or low? Did your target audience love your campaign, or was it a flop?
Without social media benchmarks (a.k.a. average performance stats for a social platform or industry), it’s difficult to make sense of raw data. But we got you. In this post, we’ve rounded up average social media engagement rates from 12 top industries to give you a better understanding of where you stand. (And empower you to brag to your boss with data-informed confidence — you’re welcome.)
We’ve even included a simple (and free!) engagement rate calculator you can use to quickly double-check your own performance stats.
Average engagement rates (June 2024)
Below, you’ll find the latest average engagement rates (per post), broken down by industry and social network.
Start free 30-day trial
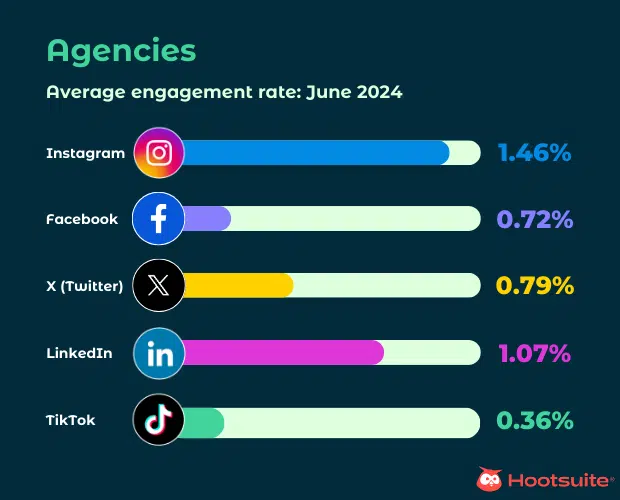
Agencies
- Average Instagram engagement rate: 1.46%
- Average Facebook engagement rate: 0.72%
- Average X (Twitter) engagement rate: 0.79%
- Average LinkedIn engagement rate: 1.07%
- Average TikTok engagement rate: 0.36%
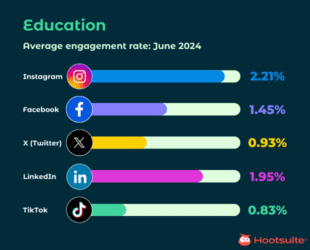
Education
- Average Instagram engagement rate: 2.21%
- Average Facebook engagement rate: 1.45%
- Average X (Twitter) engagement rate: 0.93%
- Average LinkedIn engagement rate: 1.95%
- Average TikTok engagement rate: 0.83%
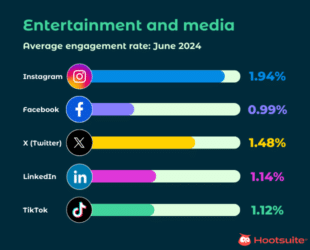
Entertainment and media
- Average Instagram engagement rate: 1.94%
- Average Facebook engagement rate: 0.99%
- Average X (Twitter) engagement rate: 1.48%
- Average LinkedIn engagement rate: 1.14%
- Average TikTok engagement rate: 1.12%
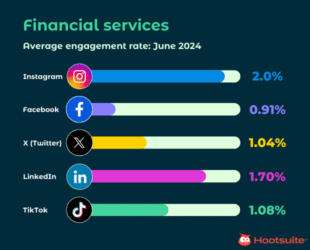
Financial services
- Average Instagram engagement rate: 2.0%
- Average Facebook engagement rate: 0.91%
- Average X (Twitter) engagement rate: 1.04%
- Average LinkedIn engagement rate: 1.70%
- Average TikTok engagement rate: 1.08%
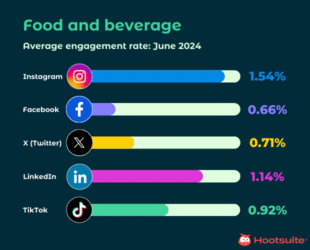
Food and beverage
- Average Instagram engagement rate: 1.54%
- Average Facebook engagement rate: 0.66%
- Average X (Twitter) engagement rate: 0.71%
- Average LinkedIn engagement rate: 1.14%
- Average TikTok engagement rate: 0.92%
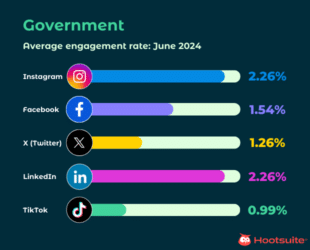
Government
- Average Instagram engagement rate: 2.26%
- Average Facebook engagement rate: 1.54%
- Average X (Twitter) engagement rate: 1.26%
- Average LinkedIn engagement rate: 2.26%
- Average TikTok engagement rate: 0.99%
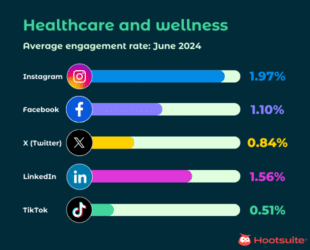
Healthcare and wellness
- Average Instagram engagement rate: 1.97%
- Average Facebook engagement rate: 1.10%
- Average X (Twitter) engagement rate: 0.84%
- Average LinkedIn engagement rate: 1.56%
- Average TikTok engagement rate: 0.51%
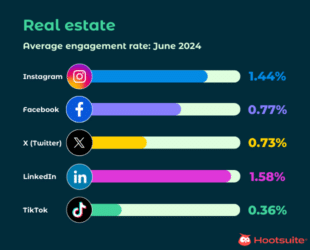
Real estate
- Average Instagram engagement rate: 1.44%
- Average Facebook engagement rate: 0.77%
- Average X (Twitter) engagement rate: 0.73%
- Average LinkedIn engagement rate: 1.58%
- Average TikTok engagement rate: 0.36%
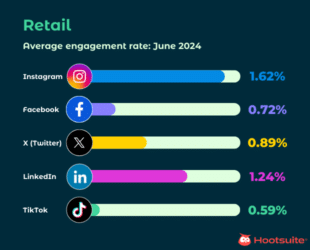
Retail
- Average Instagram engagement rate: 1.62%
- Average Facebook engagement rate: 0.72%
- Average X (Twitter) engagement rate: 0.89%
- Average LinkedIn engagement rate: 1.24%
- Average TikTok engagement rate: 0.59%
Professional services and consulting
- Average Instagram engagement rate: 1.61%
- Average Facebook engagement rate: 0.85%
- Average X (Twitter) engagement rate: 0.73%
- Average LinkedIn engagement rate: 1.44%
- Average TikTok engagement rate: 0.41%

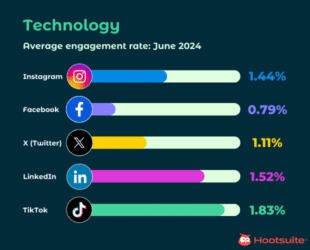
Technology
- Average Instagram engagement rate: 1.44%
- Average Facebook engagement rate: 0.79%
- Average X (Twitter) engagement rate: 1.11%
- Average LinkedIn engagement rate: 1.52%
- Average TikTok engagement rate: 1.83%
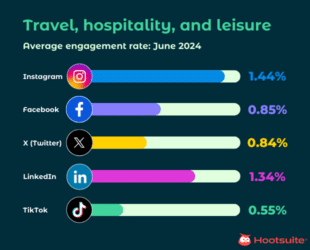
Travel, hospitality, and leisure
- Average Instagram engagement rate: 1.44%
- Average Facebook engagement rate: 0.85%
- Average X (Twitter) engagement rate: 0.84%
- Average LinkedIn engagement rate: 1.34%
- Average TikTok engagement rate: 0.55%
Average engagement rates: June insights
1. Instagram was the best platform for engagement
Instagram continues to be the best social network for businesses looking to build an engaged social following — in June, it consistently recorded the highest average engagement rates across all industries.
Brands and organizations just getting started with social media marketing can count on Instagram’s visual appeal, many interactive features, and smart algorithm for a bit of a boost.
2. Government and entertainment-related content performed well
Government and entertainment stand out as industries with high average engagement rates across all major social networks. This could be attributed to the personal and informative nature of content in these sectors, which tends to resonate well with social audiences.
3. Technology was big on TikTok
In June, the technology industry led on TikTok, with an average engagement rate of 1.83%. This likely has to do with the fact that TikTok allows for more personalization when it comes to sharing news and updates in the tech sector.
4. Government saw high performance across networks
The Government sector shows consistently high engagement rates across most major social platforms. This could be due to the nature of public service-related content and the public’s desire for transparency and communication from government agencies.
Free engagement rate calculator
Ready to compare your performance to industry benchmarks? Use this free tool to find out your engagement rate by post.
Note: If you’re calculating your account’s total engagement, include information about all your posts (e.g total number of posts published, total number of likes, and so on). If you’re calculating the engagement rate of a specific social media marketing campaign, only include the details of the posts that were part of the campaign.
If you’re looking for more detailed data or you want to calculate different kinds of engagement (like engagement rate by reach or engagement rate by impressions), download our free spreadsheet calculator that will do the math for you.
Start free 30-day trial
- Find out when your audience is online
- Get personalized recommendations for your best times to post for each of your accounts
- Easily view industry benchmarks and see how you compare to competitors