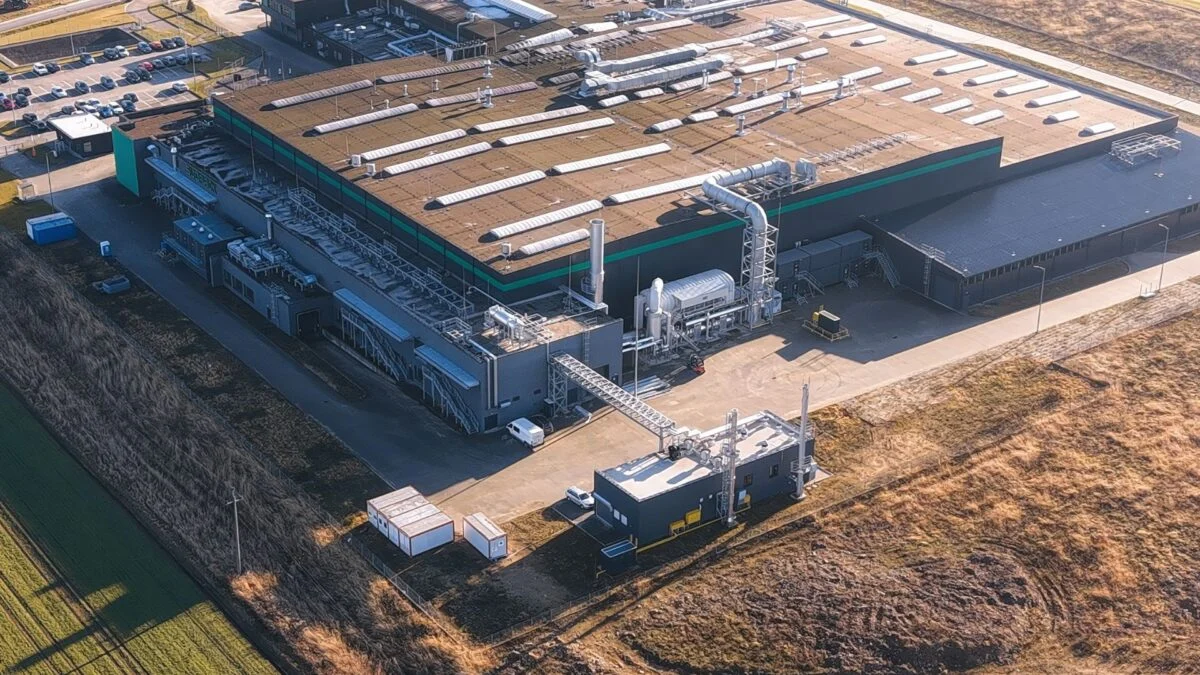
I was standing on a county road outside a midwestern town when a woman waved a laminated map at me and said, “They’re drinking the same aquifer we are.” You feel that moment shift — the abstract machine of AI becomes a neighbor with a water pipe and a permit. I watched her point to a blinking pin on a new site and knew this was the kind of trouble you can’t solve with press releases.
I’ve followed contamination fights, corporate PR, and the rare victory against a giant utility. Now I’m watching you and your neighbors log concerns about data centers into a public map led by Erin Brockovich. You should know what she’s tracking and why it matters.
A county well went dry last summer — Why Brockovich built a crowdmap for AI data centers
Brockovich’s site layers major operational, under-construction, and proposed hyperscale AI data centers over community-submitted reports. The map shows only publicly announced, AI-focused facilities that run significant AI workloads — smaller server rooms don’t appear. You can visit the project page at brockovichdatacenter.com.
Nearly every big tech player is in this race: Meta, Amazon, Microsoft, Google, OpenAI and others are investing heavily. Industry coverage estimates at least $700 billion (€650 billion) will be spent this year on AI infrastructure and development, according to CNBC. That figure helps explain why these facilities are cropping up in towns from Texas to Ohio.
What is Erin Brockovich’s data center map?
The map is a crowdsourced tracer and a public ledger. It pairs official project pins with thousands of community reports — more than 2,700 so far — and highlights hotspots, conflicts, denials, and moratoria. Texas leads the submissions with over 600 reports. Top grievances are water usage, energy drain, and health concerns.
An industrial park rejected a rezoning — How the map captures local power struggles
In several communities, opposition has stalled or killed projects. Brockovich lists 15 local moratoria and six zoning or permit denials on the site’s community impact page. That document reads like a city-by-city ledger of friction between corporate plans and municipal limits.
Think of the map like a set of fault lines: it reveals where growth collides with local life. For residents, that collision is about more than construction noise — it’s about water tables, strain on power grids, and the slow reshaping of a tax base.
How do data centers affect local communities?
They can be economic engines and big water and power consumers at once. Hyperscale centers require constant cooling and power delivery; that can stress municipal utilities and raise costs for households. In some towns, the debate becomes whether the short-term jobs and tax promises justify long-term infrastructure burdens.
A Hollywood courtroom scene is still on people’s minds — How Brockovich’s background changes the tone
You remember Julia Roberts playing Brockovich after the Pacific Gas & Electric groundwater case. That legacy gives the map a public-minded gravitas. When someone with that name points a finger at a tech project, it shifts attention quickly from corporate memos to community testimony.
At the national level, the response has been uneven. Some lawmakers want a pause on new builds. The Trump White House has generally favored a hands-off regulatory stance, arguing AI is vital for national security and competitiveness. Law enforcement has also flagged concerns about “anti-technology violent extremism,” which adds another layer of tension when public protests flare up.
The map becomes a kind of civic thermostat: it tells you where the heat is rising and where elected officials might soon be forced to act.
Can community reports stop data center projects?
Sometimes. Community opposition has helped block proposals and forced companies to withdraw or alter plans. Local moratoria, zoning defeats, and permit denials are evidence that organized civic pushback can change outcomes — especially when it combines local testimony, legal work, and media attention.
Yet big budgets and political alignment matter. With billions flowing from Wall Street and the White House signaling support for AI, communities face a David-versus-Goliath dynamic that demands sustained organizing and strategic pressure.
A small-town meeting turned into a full courtroom hearing — What to watch next
Follow these signals in the map and in local records: moratoria votes, formal complaints about water and grid capacity, and permit challenges. Brockovich’s effort stacks those signals into a public narrative that reporters, regulators, and residents can use.
For journalists and activists, the map is a tool and a challenge. For companies — including Meta, Amazon, Microsoft, Google, and OpenAI — it’s public scrutiny that can complicate site selection and timelines. For you, it’s a way to convert worry into data that regulators and local officials can’t easily ignore.
Erin Brockovich has been fighting industrial pollution long enough to know how leverage works: community testimony, legal teeth, and public pressure. Her map is adding geographic clarity to that playbook, and it’s asking one simple question: who pays for the cost of AI’s growth?
Are we ready to let companies write the terms for entire towns, or will communities assert the right to say no?